雅思官方白金级合作伙伴
咨询电话:0312-59361112021-07-22 16:35:52 编辑:保定环球教育 浏览:(446次)
保定环球雅思咨询热线:0312-5936111
环球教育保定雅思培训学校提供:雅思Task1小作文柱状图范文之垃圾制造!关注环球教育保定分校(bdgedu)微信公众号,获取更多保定雅思资讯。
话题:
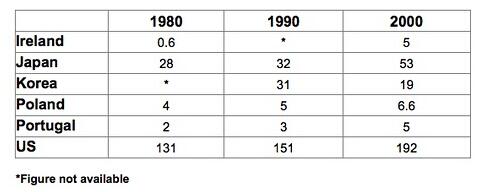
The table below shows the amount of waste production (in millions of tonnes) in six different countries over a twenty-year period.

范文:
The chart compares the amounts of waste that were produced in six countries in the years 1980, 1990 and 2000.
In each of these years, the US produced more waste than Ireland, Japan, Korea, Poland and Portugal combined. It is also noticeable that Korea was the only country that managed to reduce its waste output by the year 2000.
Between 1980 and 2000, waste production in the US rose from 131 to 192 million tonnes, and rising trends were also seen in Japan, Poland and Portugal. Japan’s waste output increased from 28 to 53 million tonnes, while Poland and Portugal saw waste totals increase from 4 to 6.6 and from 2 to 5 million tonnes respectively.
The trends for Ireland and Korea were noticeably different from those described above. In Ireland, waste production increased more than eightfold, from only 0.6 million tonnes in 1980 to 5 million tonnes in 2000. Korea, by contrast, cut its waste output by 12 million tonnes between 1990 and 2000.

相关推荐:
咨询热线:18931203815
北京环球天下教育科技有限公司 版权所有 客服信箱:Marketing@gedu.org
投诉电话:010-62125800-2572 Copyright © 1997-2020 Global Education. All rights reserved.